Why we were in Honolulu
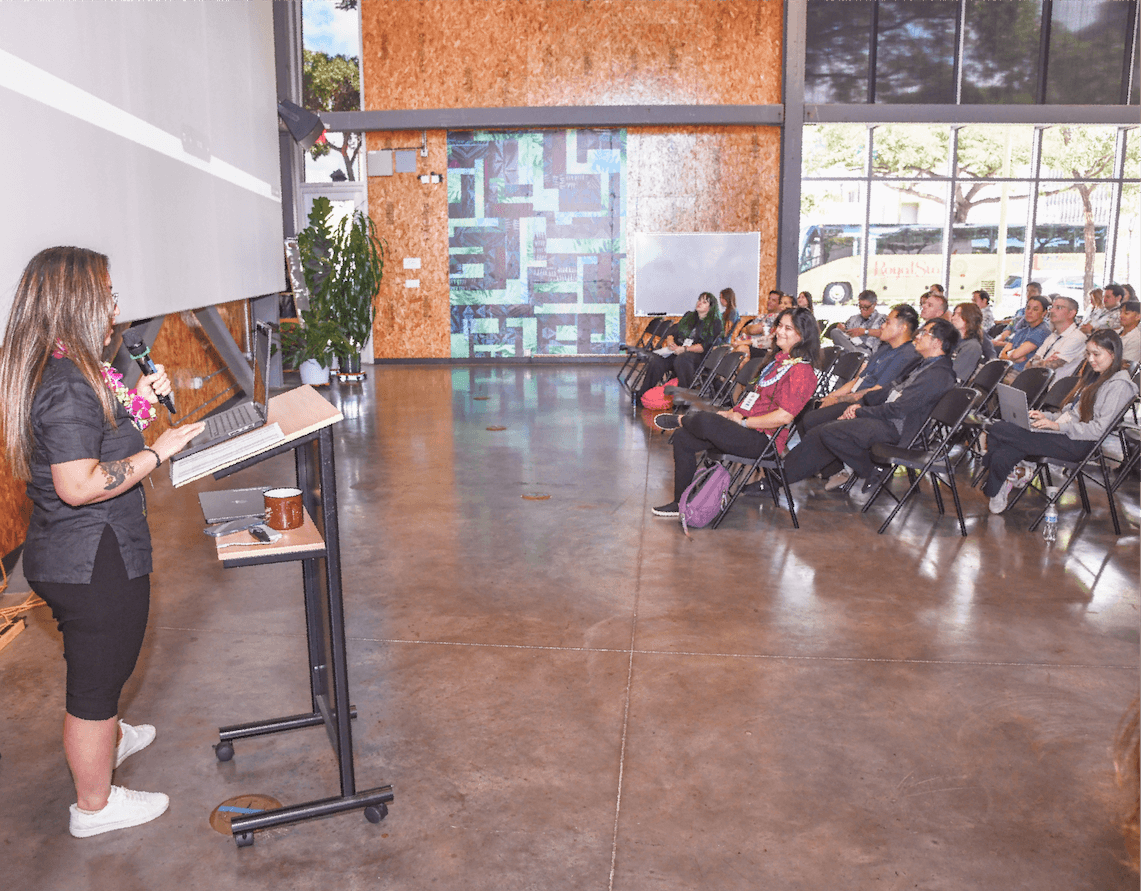
On October 17, I presented a case study on the Health Equity Tracker at the 4th Annual UXHI Conference in Honolulu, a one-day gathering of Hawaiʻi's design community. The conference theme was moʻolelo, the Hawaiian practice of shaping, carrying, and contextualizing a story. A health data tool does all three, whether or not it means to.
My talk, "Designing CHARLIE," followed one idea through the Tracker: how to make health equity data usable by people who were never the audience for a research dashboard. This is the short version for anyone who could not be there.
Why rates, not totals
The first thing I showed the room was why the Tracker reports rates per 100,000 people instead of raw counts. Picture Kapolei, with about 22,000 residents, and Honolulu, with about 345,000. Say 500 people in each place have the same health condition. The totals match, but the places do not: in Kapolei that is about 1 in 44 people, and in Honolulu about 1 in 690. Per 100,000 people, that is roughly 2,270 in Kapolei and 145 in Honolulu, a gap of about fifteen times.
Those numbers are illustrative, not real health data. The point is that bigger places almost always have bigger totals simply because more people live there. A rate puts every place on the same scale, so a small community can be compared fairly with one many times its size. That is also why the Tracker exists: scattered, inconsistent data hides who is being hurt most.
What the community told us
Around 2024, the Tracker standardized its gun violence dataset, and a private philanthropic foundation supported the work. I built an early Policy Hub prototype inside HET's real codebase, not a prototyping tool, so people could actually use it. I did not grow up in the Atlanta advocacy community, so my UX research on the copy could only take the hub so far. Then came the step I most wanted to share with a design audience. My colleagues Ben Hammond and Eric Warren and I brought unreleased data and the prototype to a room of Atlanta-based violence-intervention leaders, researchers, and public health partners, and asked them to break it before we built any further.

They did, and four requests changed the work:
- Zip-code detail, not just county, tied to the neighborhoods their organizations serve.
- A real definition behind the phrase "gun violence is a public health problem," not just the quote.
- "Legal intervention" shown with its definitions side by side, because the term means different things depending on who you ask.
- First-person storytelling, with an anonymous option for people not ready to attach their names.
That is the difference between feedback from people building alongside you and feedback from the people the tool is for.
From CHARLIE to AI insights, and a Georgia prototype
After that research, the work had a name waiting for it. CHARLIE, short for Community Health Analytics and Responsive Learning Intelligence Engine, began as an idea Ben pitched to an outside AI grant program. It was not funded, but the name stuck, and I carried it into Bubble's Immerse pre-accelerator. My pitch there was a global tracker, which turned out to be a brutal build, so I scoped down to gun violence. The first version let you pick a topic, a place, and a demographic in plain language, a MadLib in place of a filter panel, and every answer came back in the same five parts (what we found, how places compare, who is most affected, what it means, what to do). Ben and Eric later carried that pattern into the Tracker's own AI insights feature, which is described on the Tracker's methodology page.
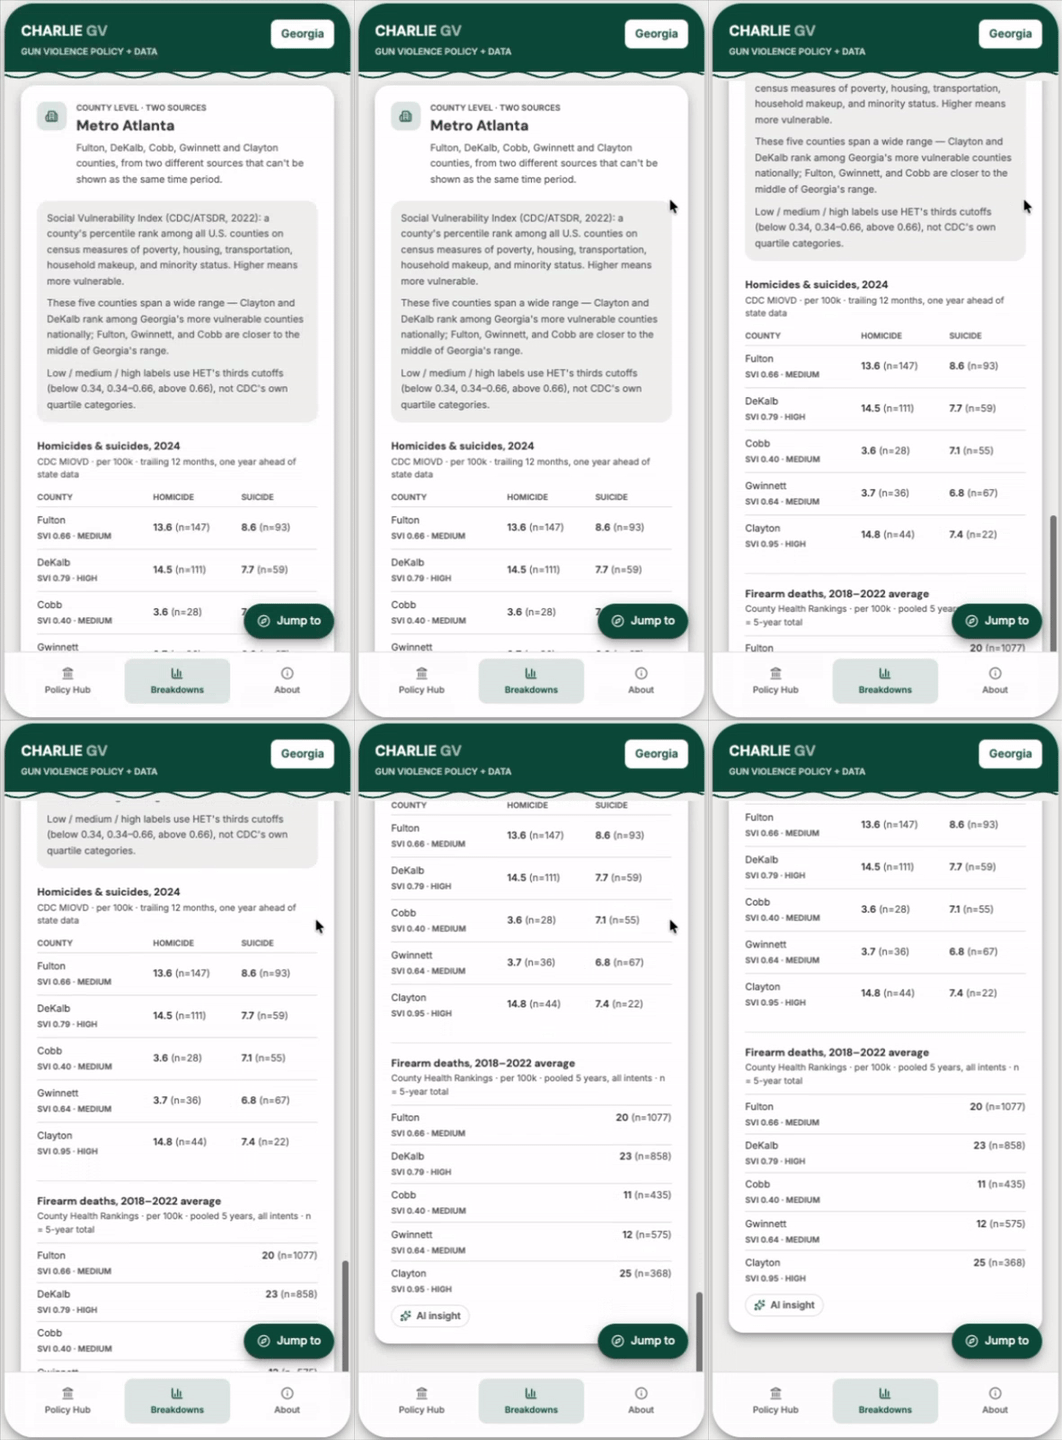
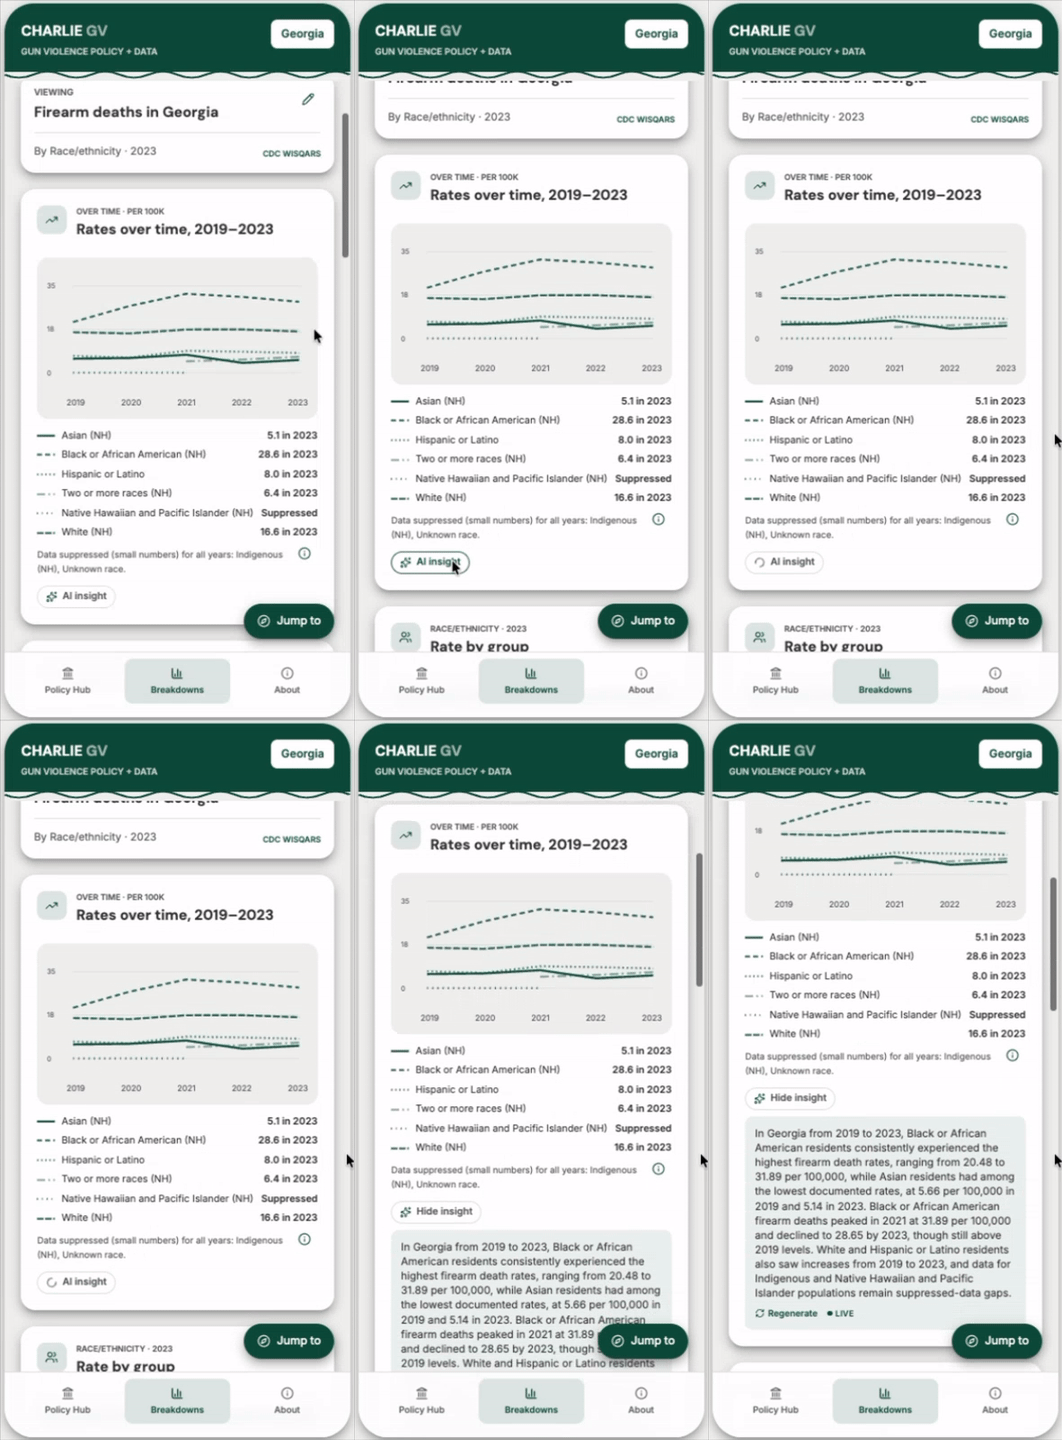
I am now prototyping what I could not build the first time: insights and the Policy Hub in one place. CHARLIE GV is a mobile prototype scoped to Georgia, built with Lovable and Claude. It shows real CDC WISQARS rates as published by the Tracker, and it writes plain-language summaries with Claude, with a pre-written fallback if the live call is slow or fails. The policy statuses in the prototype are illustrative, and the app says so on screen.
We narrowed to Georgia because the Violence Prevention Collaborative of Metro Atlanta, a coalition of the Satcher Health Leadership Institute, 100 Black Men of Atlanta, and The King Center, already lists the Tracker as its top data resource. Narrowing was a way of building toward an audience that already exists.
What stayed with me from the room
The day opened with an icebreaker led by Sean Tangco. Everyone filled out a short form, and the answers fed a relationship map built in Kumu that grouped us by what we had in common. Then we stood up, walked around the warehouse, and found our groups. It turned a dataset into a physical reason to talk story with strangers, and it worked.
I also met an engineer who recently joined the Purple Maʻia Foundation to work on Hākilo, a free app for daily observation practice rooted in the Hawaiian practice of kilo. I have not tried it yet, but it is a clear example of engineering work grounded in place.
Dr. Kari Noe closed our case study session with the Create(x) Lab at the University of Hawaiʻi West Oʻahu, a living lab where creative media, technology, art, and culture meet. I graduated from UHWO in 2013, so hearing about it felt like coming full circle.
Where to find the Tracker
The question the conference put to us was whose moʻolelo a system carries. For the Tracker, the answer has to include people who were never the audience for a research dashboard, and we only learn that by asking them. My closing ask to the room applies here too: find the gap you are positioned to see, and build something honest enough to say so.
The Health Equity Tracker is free and open source at healthequitytracker.org.
UX
Gun Violence
Health Equity
HET Updates
Military